This paper describes a novel scheme to reduce the quantization noise of compressed videos and improve the overall coding performances. The proposed scheme first consists in clustering noisy patches of the compressed sequence. Then, at the encoder side, linear mappings are learned for each cluster between the noisy patches and the corresponding source patches. The linear mappings are then transmitted to the decoder where they can be applied to perform de-noising. The method has been tested with the HEVC standard, leading to a bitrate saving of up to 9.63%.
Modern video codecs such as HEVC rely on four main steps, which aim at reducing the redundancies of the signal. First, spatial and temporal redudancies are reduced through prediction tools. The prediction residue is then transformed to further reduce the inner correlations of the signal, and the transformed coefficients are then quantized to remove non-perceptible information. The quantized transformed coefficients are finally entropy coded to remove the remaining statistical redundancies. Because the quantization step is not revertible at the decoder side, the reconstructed frames are corrupted with a so-called quantization noise. The goal of this work is to improve the rate-distortion (RD) performances of existing compression schemes using a novel out-of-the-loop de-noising scheme.
The proposed scheme is represented in Fig. 1, and consists in the following steps:
At the encoder side:
At the decoder side:

Proposed compression scheme using noise removal based on clustering and linear mapping learning.
Alternatively, we propose a two steps scheme represented in Fig. 2, where a blind de-noising algorithm is first performed on the decoded frames, before applying the proposed mehtods.

Alternative two step schemes with first pass blind de-noising.
Selecting the number of clusters K is crucial for the overall RD performances, as increasing K improves the de-noising performances, but also the bit-rate associated to the projection functions. We thus propose an adative method to select K, based on a rate-distortion optimization (RDO) criterion, which proceeds as follow:
To perform the exact same partitioning at the decoder, we then need to transmit the binary tree structure.
The aforementioned RDO criterion can be computed for each cluster, first by estimating the distortion between the de-noised patches of the cluster and the corresponding source patches. The rate is then esitmated as the number of bits of the encoded projection function used to de-noise the patches. Thus, to decide if a cluster $C_{n}$ is further divided into two clusters $C_{n+1}$ and $C_{n+2}$, we merely check the following condition on the associated rate distortion costs: $J_{n+1} + J_{n+2} < J_n$. An example of binary tree structure obtained after recursive paritioning is given in Fig. 3.

Example of a cluster partition based on a binary tree structure and an RDO criterion. The clusters are recursively split to reach 4 clusters. The tree structure is described by only 5 bits.
We propose a so-called oracle clustering, which goal is to maximize the de-noising performances of the proposed scheme for a fixed number of clusters $K$. Formally, the oracle clustering solve the following problem:
$$\min_C \sum_{i=1 \dots K} \sum_{x_d,x_s \in C_i} || x_s - \textbf{P}_i x_d || ^2 $$
where $x_s$ and $x_d$ are corresponding source and decoded patches respectively, and $\textbf{P}_i$ is the projection function corresponding to the cluster $C_i$.
This oracle clustering is not reproducible at the decoder side, as it relies on the knowledge of the source patches, and thus can not be directly applied in the proposed scheme. However, it allows to define an upper bound on the performances.
 |
 |
|---|---|
| First frame of the Kimono source sequence. | First frame of the Kimono sequence encoded with HEVC at QP=37. Decoded PSNR = 37.95dB. |
 |
 |
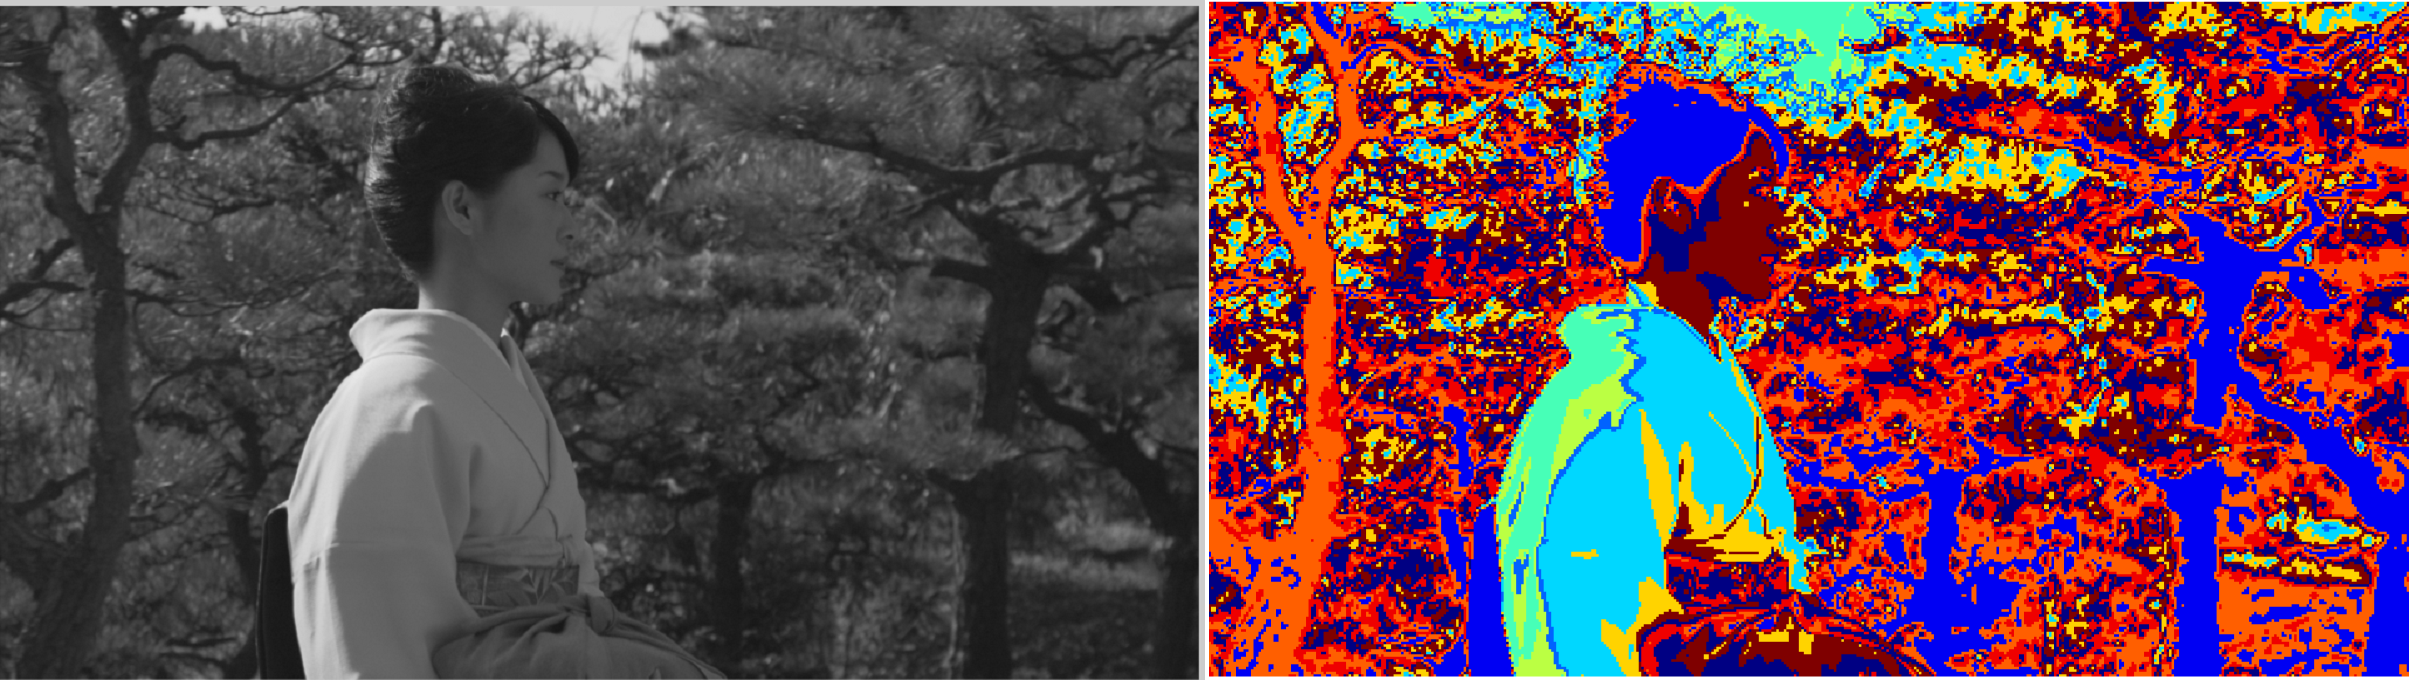
| K-means clustering (K=10) performed on non-overlapping 4x4 patches of the Kimono sequence encoded with HEVC at QP=37. Each color correspond to a cluster label. Corresponding de-noised PSNR = 38.07 dB. | Oracle clustering (K=10) performed on non-overlapping 4x4 patches of the Kimono sequence encoded with HEVC at QP=37. Each color correspond to a cluster label. Corresponding de-noised PSNR = 41.26 dB. |
The sequences used in the experiment are presented in Table 1, and mainly consist in HEVC test sequences. The test sequences are processed per Group Of Pictures (GOP), where a GOP contains a number of frames equal to the frame rate (i.e. we have one GOP per second). The sequences are encoded with the HEVC test model HM (ver 15.0) using the Main profile in Random Access, with 4 values for the Quantization Parameter, QP=22, 27, 32, 37.
| Sequence | Resolution | Frame count | Frame rate |
|---|---|---|---|
| City | 1280x720 | 600 | 60 |
| ParkScene | 1920x1080 | 240 | 24 |
| Tennis | 1920x1080 | 240 | 24 |
| Kimono | 1920x1080 | 240 | 24 |
| Cactus | 1920x1080 | 500 | 50 |
| Terrace | 1920x1080 | 600 | 60 |
| Basket | 1920x1080 | 500 | 50 |
| Ducks | 1920x1080 | 500 | 50 |
| PeopleOnStreet | 2560x1600 | 150 | 30 |
| Traffic | 2560x1600 | 150 | 30 |
We show in Table 2 the RD performances of our method (without first pass de-noising, see Fig. 1) for each GOP of the test sequences, performed with fixed number of clusters K=10.
| GOP | City | Park Scene | Tennis | Kimono | Cactus | Terrace | Basket | Ducks | People On Street | Traffic | Average |
|---|---|---|---|---|---|---|---|---|---|---|---|
| 1 | -2.31 | 0.12 | -0.06 | -0.13 | -1.16 | -5.38 | -0.83 | -2.32 | -2.54 | -1.29 | -1.59 |
| 2 | -1.76 | 0.15 | 0.09 | -0.13 | -1.22 | -7.14 | -0.43 | -1.81 | -2.55 | -1.23 | -1.60 |
| 3 | -1.96 | 0.09 | 0.18 | -0.20 | -0.88 | -8.62 | -0.87 | -1.02 | -2.54 | -1.22 | -1.70 |
| 4 | -1.74 | 0.18 | 0.10 | -0.24 | -0.81 | -11.69 | -0.74 | -1.16 | -2.60 | -1.18 | -1.99 |
| 5 | -0.96 | 0.30 | 0.10 | -0.19 | -1.05 | -12.15 | -0.65 | -1.20 | -2.58 | -1.31 | -1.97 |
| 6 | -1.90 | 0.47 | 1.60 | 0.35 | -1.20 | -10.05 | -0.43 | -1.61 | -1.60 | ||
| 7 | -1.59 | 0.48 | 1.45 | 1.22 | -1.11 | -8.49 | -0.51 | -2.01 | -1.32 | ||
| 8 | -1.98 | 0.50 | 1.05 | 1.42 | -1.34 | -7.53 | -0.71 | -2.36 | -1.37 | ||
| 9 | -1.84 | 0.59 | 0.84 | 1.90 | -1.03 | -6.73 | -0.74 | -2.49 | -1.19 | ||
| 10 | -1.92 | 0.97 | 0.77 | 2.54 | -0.91 | -6.79 | -0.49 | -2.76 | -1.07 | ||
| Average | -1.81 | 0.38 | 0.08 | 0.43 | -1.08 | -8.28 | -0.65 | -1.88 | -2.56 | -1.26 | -1.66 |
We show in Table 3 the RD performances of our method (without first pass de-noising, see Fig. 1) for each GOP of the test sequences, performed with the adaptive selection of the number of clusters (Kmax=16). In addition, we give in Table 4 the selected K values depending on the quantization parameter and averaged over all GOPs. We can see that the K values adapt to the sequence, reaching higher values for sequences with a higher resolution and/or frame rate. The K values also vary depending on QP, and lower values are selected at low bit-rate (high QP value).
| GOP | City | Park Scene | Tennis | Kimono | Cactus | Terrace | Basket | Ducks | People On Street | Traffic | Average |
|---|---|---|---|---|---|---|---|---|---|---|---|
| 1 | -2.76 | -0.69 | -0.90 | -1.32 | -1.12 | -5.25 | -1.10 | -2.39 | -2.57 | -1.44 | -1.96 |
| 2 | -2.31 | -0.67 | -0.72 | -1.35 | -1.29 | -6.83 | -0.40 | -1.82 | -2.58 | -1.39 | -1.93 |
| 3 | -2.45 | -0.63 | -0.78 | -1.36 | -0.89 | -8.86 | -0.98 | -1.08 | -2.59 | -1.35 | -2.10 |
| 4 | -1.66 | -0.54 | -0.82 | -1.31 | -0.98 | -11.58 | -0.62 | -1.24 | -2.61 | -1.35 | -2.27 |
| 5 | -1.84 | -0.52 | -0.72 | -0.89 | -1.11 | -11.95 | -0.76 | -1.27 | -2.63 | -1.53 | -2.32 |
| 6 | -2.22 | -0.48 | -1.08 | -0.85 | -1.37 | -9.90 | -0.77 | -1.71 | -2.30 | ||
| 7 | -1.90 | -0.48 | -1.91 | -0.58 | -1.25 | -8.20 | -0.68 | -2.13 | -2.14 | ||
| 8 | -1.86 | -0.40 | -2.39 | -0.58 | -1.30 | -7.23 | -1.09 | -2.47 | -2.16 | ||
| 9 | -2.51 | -0.31 | -1.77 | -0.43 | -1.19 | -6.35 | -0.88 | -2.58 | -2.00 | ||
| 10 | -2.74 | 0.02 | -2.52 | 0.29 | -1.00 | -6.47 | -0.69 | -2.84 | -1.99 | ||
| Average | -2.24 | -0.47 | -1.41 | -0.94 | -1.15 | -8.08 | -0.80 | -1.96 | -2.60 | -1.42 | -2.11 |
| QP | City | Park Scene | Tennis | Kimono | Cactus | Terrace | Basket | Ducks | People On Street | Traffic | Average |
|---|---|---|---|---|---|---|---|---|---|---|---|
| 22 | 10.8 | 8.5 | 7.6 | 8.2 | 14.9 | 15.4 | 12.0 | 15.9 | 16.0 | 14.0 | 12.3 |
| 27 | 11.3 | 6.8 | 5.7 | 6.4 | 11.7 | 15.0 | 9.7 | 15.8 | 16.0 | 12.6 | 11.1 |
| 32 | 7.4 | 4.0 | 3.4 | 4.5 | 9.0 | 14.1 | 7.8 | 15.8 | 16.0 | 7.6 | 9.0 |
| 37 | 5.9 | 4.0 | 2.8 | 4.0 | 7.1 | 13.1 | 5.8 | 15.5 | 15.8 | 5.8 | 8.0 |
| Average | 8.9 | 5.8 | 4.9 | 5.8 | 10.7 | 14.4 | 8.8 | 15.8 | 16.0 | 10.0 | 10.1 |
We show in Table 5 the RD performances of the proposed two steps scheme (see Fig. 2), with a first pass VBM3D de-noising, for the first GOP of the test sequences, performed with the adaptive selection of the number of clusters (Kmax=16). In addition, we give in Table 6 the selected K values depending on the quantization parameter.
| Sequence | BD-rate |
|---|---|
| City | -3.24 |
| Park Scene | -1.07 |
| Tennis | -7.77 |
| Kimono | -4.32 |
| Cactus | -6.19 |
| Terrace | -7.24 |
| Basket | -3.80 |
| Ducks | -4.13 |
| People On Street | -9.63 |
| Traffic | -5.43 |
| Average | -5.28 |
| QP | City | Park Scene | Tennis | Kimono | Cactus | Terrace | Basket | Ducks | People On Street | Traffic | Average |
|---|---|---|---|---|---|---|---|---|---|---|---|
| 22 | 15.0 | 12.0 | 9.0 | 7.0 | 16.0 | 16.0 | 11.0 | 16.0 | 16.0 | 15.0 | 13.3 |
| 27 | 15.0 | 8.0 | 7.0 | 6.0 | 13.0 | 16.0 | 11.0 | 16.0 | 16.0 | 12.0 | 12.0 |
| 32 | 10.0 | 6.0 | 6.0 | 6.0 | 12.0 | 16.0 | 9.0 | 16.0 | 15.0 | 13.0 | 10.9 |
| 37 | 9.0 | 4.0 | 5.0 | 4.0 | 11.0 | 15.0 | 5.0 | 16.0 | 15.0 | 6.0 | 9.0 |
| Average | 12.3 | 7.5 | 6.8 | 5.8 | 13.0 | 15.8 | 9.0 | 16.0 | 15.5 | 11.5 | 11.3 |
Finally, we show in Table 7 the upper bound on the RD performances obtained with the oracle clustering.
| GOP | City | Park Scene | Tennis | Kimono | Cactus | Terrace | Basket | Ducks | People On Street | Traffic | Average |
|---|---|---|---|---|---|---|---|---|---|---|---|
| 1 | -28.85 | -22.38 | -30.48 | -40.90 | -23.28 | -29.93 | -32.60 | -31.03 | -23.11 | -25.35 | -28.79 |
| 2 | -28.34 | -22.40 | -30.39 | -42.10 | -24.62 | -34.49 | -29.80 | -28.40 | -23.15 | -25.52 | -28.92 |
| 3 | -28.35 | -21.86 | -30.61 | -41.10 | -24.89 | -41.78 | -30.62 | -18.31 | -23.07 | -25.31 | -28.59 |
| 4 | -29.20 | -21.43 | -30.92 | -40.77 | -26.09 | -48.57 | -27.25 | -16.72 | -23.88 | -25.68 | -29.05 |
| 5 | -28.89 | -21.07 | -30.34 | -40.85 | -25.08 | -46.06 | -29.78 | -16.08 | -23.07 | -25.65 | -28.69 |
| 6 | -29.43 | -21.50 | -44.94 | -38.14 | -24.65 | -39.84 | -31.07 | -18.51 | -31.01 | ||
| 7 | -29.19 | -21.66 | -45.89 | -25.38 | -24.21 | -38.70 | -29.48 | -20.69 | -29.40 | ||
| 8 | -29.08 | -21.71 | -46.38 | -25.24 | -24.71 | -37.85 | -30.36 | -22.64 | -29.75 | ||
| 9 | -28.89 | -21.37 | -45.92 | -25.17 | -24.53 | -35.55 | -27.57 | -23.33 | -29.04 | ||
| 10 | -29.01 | -21.24 | -46.14 | -16.37 | -12.72 | -42.21 | -21.39 | -24.99 | -26.76 | ||
| Average | -28.92 | -21.66 | -38.20 | -33.60 | -23.48 | -39.50 | -28.99 | -22.07 | -23.26 | -25.50 | -28.52 |
We display below a summary of the RD performances of the different versions of the proposed scheme, in the form of RD curves for the first GOP of each sequence.
 |
 |
|---|---|
| RD performances for the first GOP of the City sequence. | RD performances for the first GOP of the Park Scene sequence. |
 |
 |
| RD performances for the first GOP of the Tennis sequence. | RD performances for the first GOP of the Kimono sequence. |
 |
 |
| RD performances for the first GOP of the Cactus sequence. | RD performances for the first GOP of the Terrace sequence. |
 |
 |
| RD performances for the first GOP of the Basket sequence. | RD performances for the first GOP of the Ducks sequence. |
 |
 |
| RD performances for the first GOP of the People On Street sequence. | RD performances for the first GOP of the Traffic sequence. |